Predictrix
Welcome to Predictrix, a real-time user behavior analysis application designed to
simulate and analyze user interaction data.
The Goal Of This Project Is To Showcase My Expertise In :
- Data generation using Python
- Integration with Splunk using HTTP Event Collector (HEC)
- Predictive analytics using the Splunk Machine Learning Toolkit (MLTK)
- Real-time alerts & Data Monitioring using Splunk Dashboard
This project includes:
- Data Generation & Ingestion: A Python script simulates user interaction data and sends it to Splunk using the HTTP Event Collector (HEC).
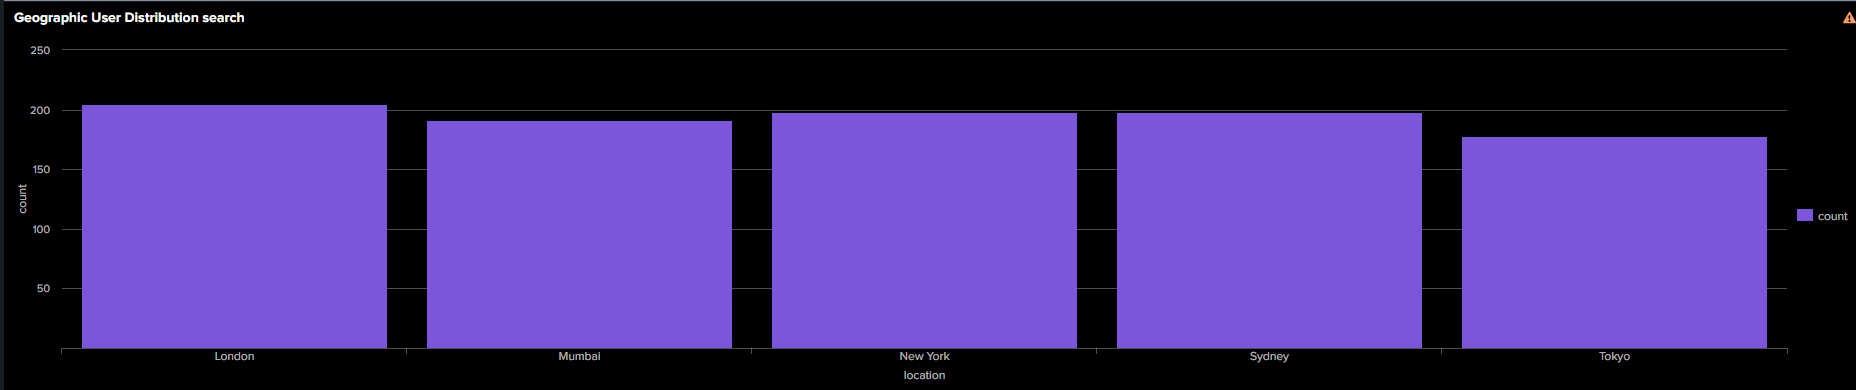
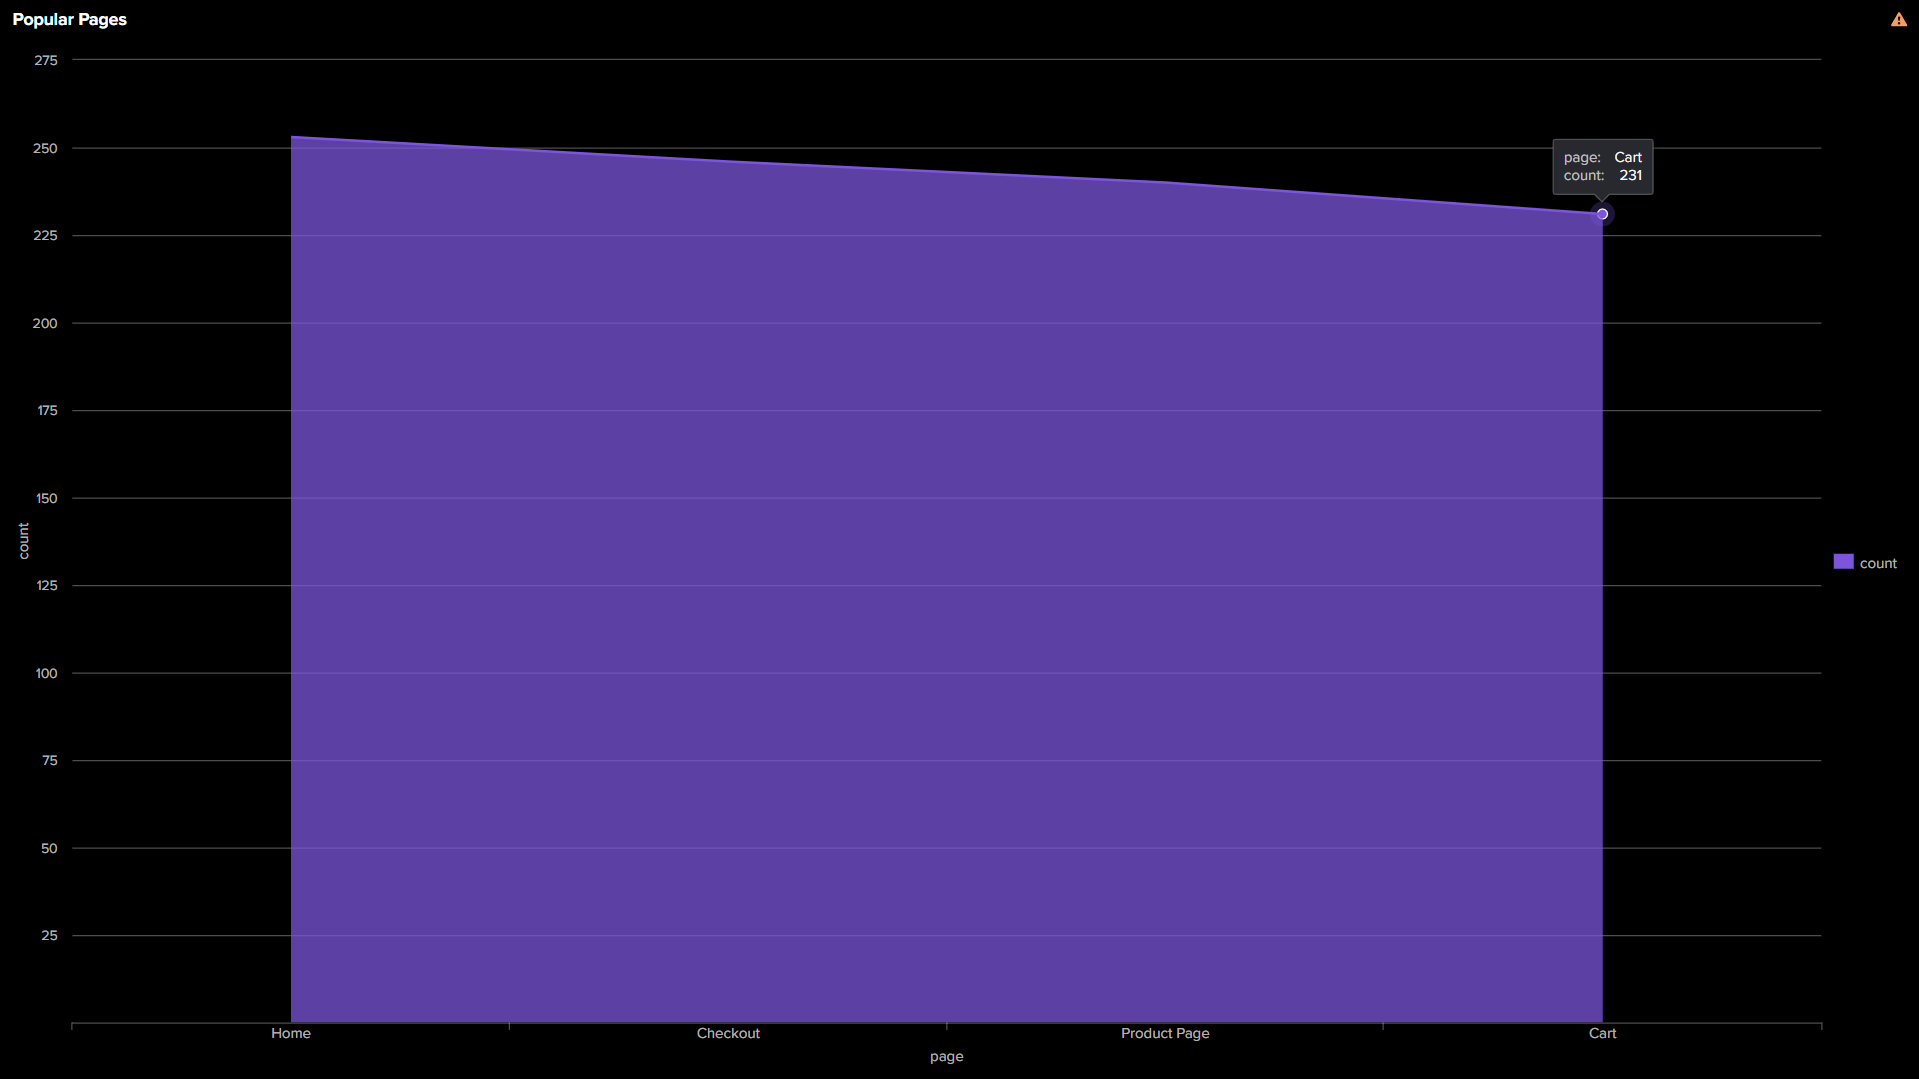
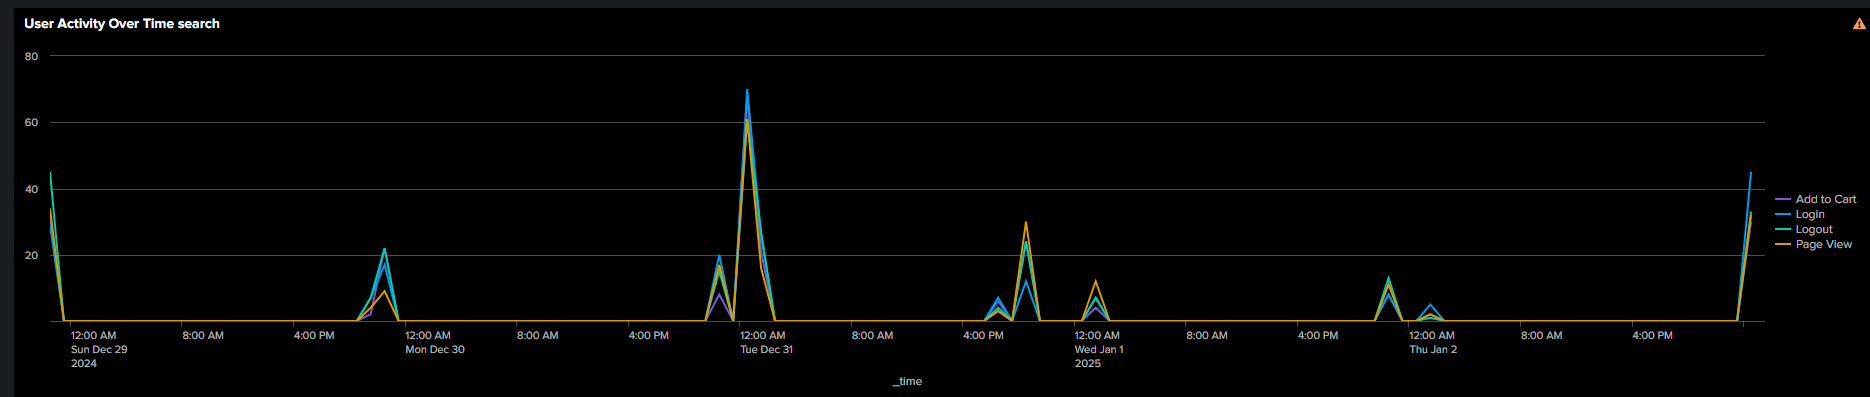
- Splunk Dashboards: Visualize key user metrics such as engagement, login activity, event frequency, and device usage.
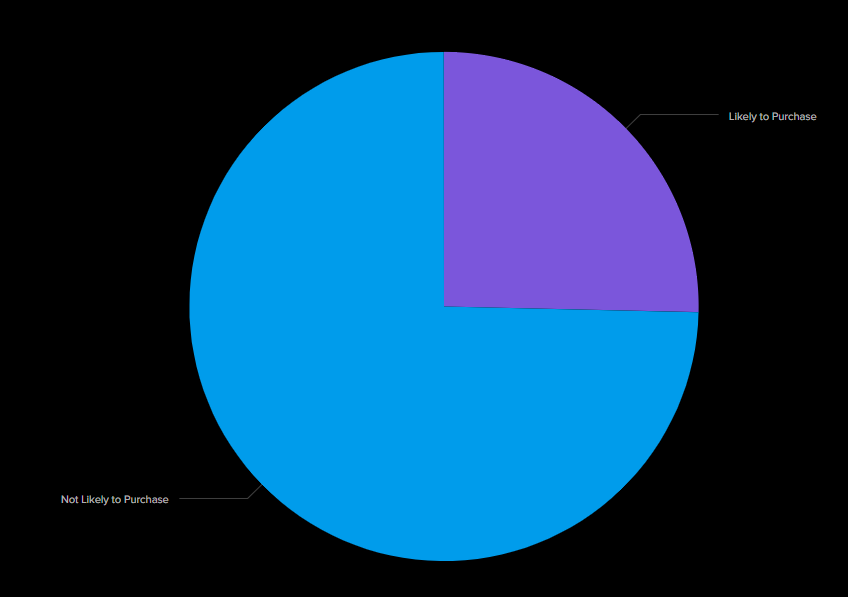
- Predictive Insights: Using Splunk MLTK, we predict user behaviors, such as the likelihood of a purchase.
- Alerts: Get notified of critical events, such as abandoned carts or increased error logs.
What Does Predictrix Do?
Predictrix is a comprehensive user behavior analysis tool designed to simulate, analyze, and predict user interactions in real-time. The key features of Predictrix include:
- Real-time Data Simulation: Generate random logs simulating user actions such as "Add to Cart", "Login", and "Page View".
- Splunk Integration: Data is ingested into Splunk via the HTTP Event Collector (HEC) for real-time analysis.
- Predictive Analytics: Leverage Splunk MLTK to predict user behaviors like purchase likelihood based on interaction patterns.
- Real-time Alerts: Alerts for key events like abandoned carts or spikes in error logs to ensure timely responses.
1. Python Script to Simulate User Interaction Data
The Predictrix project starts by simulating user interaction logs using a Python script. The script creates random logs to mimic typical user actions like adding items to the cart, logging in, viewing pages, and more.
How Data Gets Into Splunk - Detailed Flow
- Data Generation (via Python script): The Python script simulates user interaction logs (such as Add to Cart, Page View, Login, etc.)
with various attributes like user_id, device, location, page, and timestamp. These logs are structured as JSON events,
which is a common format for sending structured data to Splunk.
- Sending Data to Splunk (via HTTP Event Collector): The logs are sent to Splunk using the HTTP Event Collector (HEC).
The HEC endpoint URL (https://127.0.0.1:8088/services/collector) is specified in the Python script.
Each log event is wrapped in a JSON payload and sent using a POST request.
The HEC request includes headers such as the Authorization token,
ensuring only authorized sources can send data to Splunk.
- Event Data Format: The log event being sent follows this format:
{
    "event": {
        "user_id": 123,
        "event": "Add to Cart",
        "device": "Desktop",
        "location": "USA",
        "page": "Product",
        "timestamp": 1609459200
    }
}
- Splunk HEC Receives and Indexes Data: Upon receiving the log through HEC, Splunk parses the incoming data.
The event is then indexed under the predictrix index (search query index=predictrix).
The event gets associated with default fields like timestamp, host, source, and sourcetype.
- Splunk Data Structure: Once the event data is in Splunk, We can perform various operations on it. For example:
index=predictrix | stats count by user_id
Python Script Code
# Python code example

import random
import json
import requests

def generate_user_interaction():
    actions = ["Add to Cart", "Login", "Page View"]
    user_interaction = {
        "user_id": random.randint(1, 1000),
        "event": random.choice(actions),
        "device": random.choice(["Desktop", "Mobile", "Tablet"]),
        "location": random.choice(["USA", "Canada", "UK"]),
        "page": random.choice(["Home", "Product", "Checkout"]),
        "timestamp": random.randint(1609459200, 1640995200)
    }
    return json.dumps(user_interaction)

def send_to_splunk(data):
    url = "https://127.0.0.1:8088/services/collector"
    headers = {"Authorization": "Splunk YOUR_SPLUNK_HEC_TOKEN"}
    response = requests.post(url, headers=headers, data=data)
    return response.status_code

if __name__ == "__main__":
    for _ in range(10):
        log = generate_user_interaction()
        status = send_to_splunk(log)
        print(f"Sent log with status code: {status}")
2. Predictive Insights
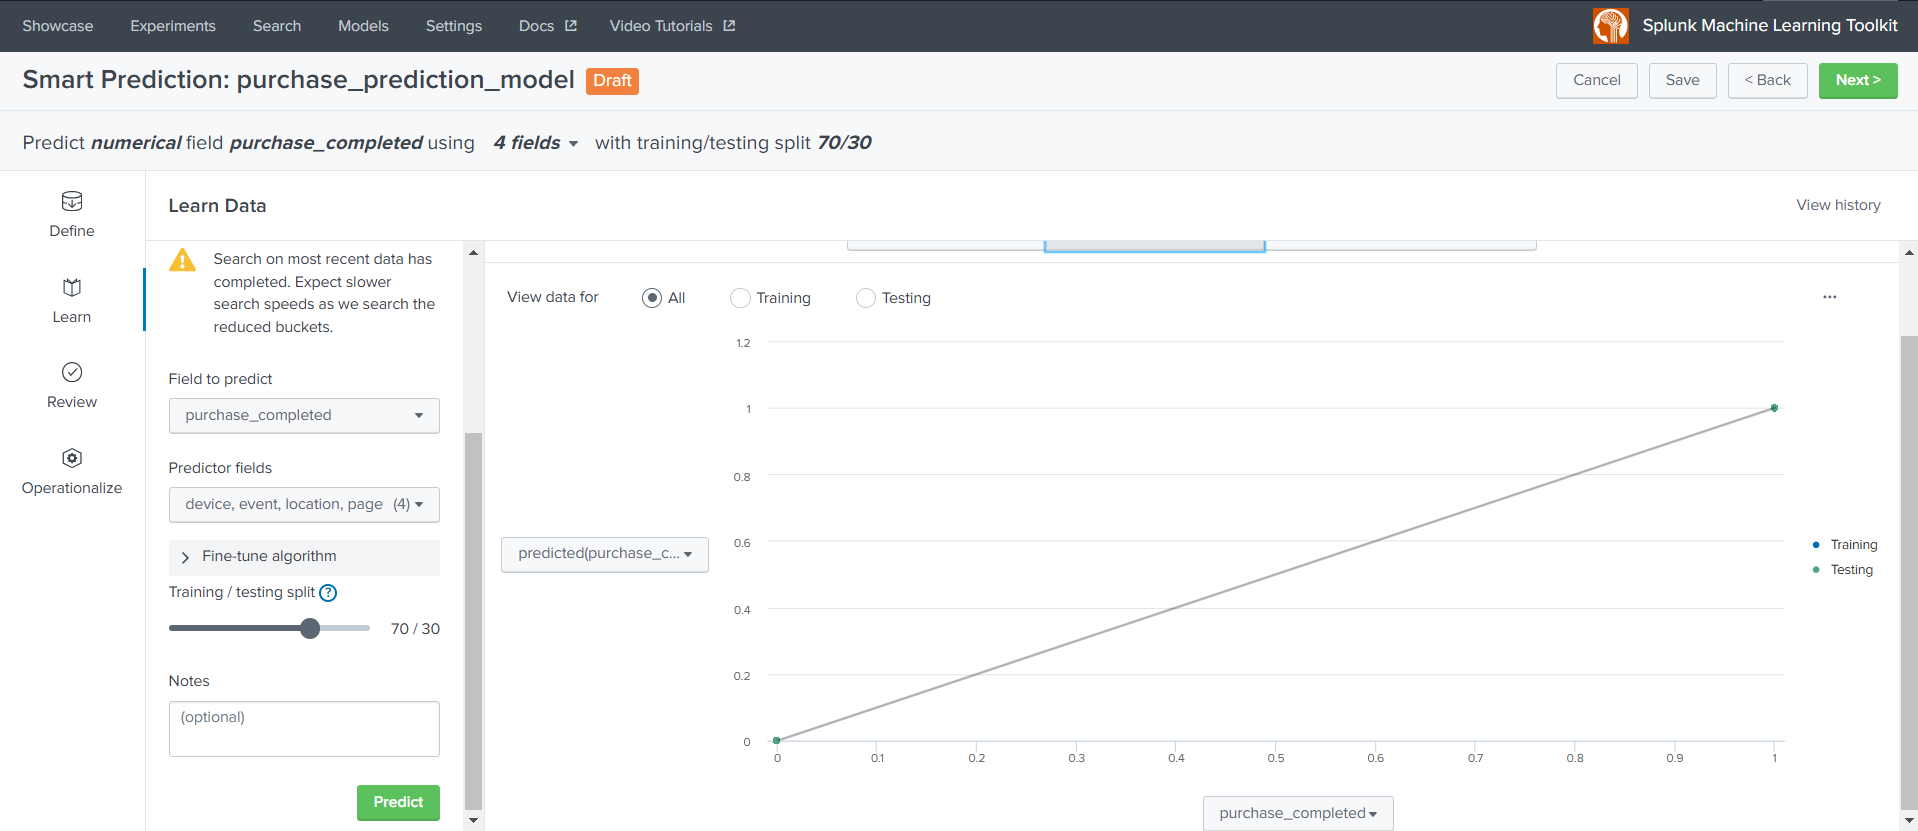
Using Splunk MLTK, we predict user behaviors based on interaction history.
The Predictrix platform leverages Splunk's Machine Learning Toolkit (MLTK) to create a predictive model that
forecasts user purchase completion based on their interactions and behaviors. The following details highlight the model setup,
data processing, and key configurations:
- Data Preparation: The dataset used for this model originates from the index=predictrix.
A crucial transformation is applied to label the target field purchase_completed, where:
- A value of 1 indicates a purchase was completed (when page="Checkout").
- A value of 0 indicates no purchase.
- The Splunk query for data preparation:
index=predictrix | eval purchase_completed=if(page=="Checkout",1,0)
                 | table device, event, location, page, purchase_completed
- This query ensures the dataset includes relevant fields for analysis and prediction:
- Features: device, event, location, page
- Target Field: purchase_completed
- Model Details:
- Model Type: Experiment: Smart Prediction, Algorithm: AutoPrediction
- Splunk's AutoPrediction automates the selection of a suitable machine learning algorithm, enabling seamless experimentation.
- Field to Predict: purchase_completed (binary classification: 1 for purchase, 0 for no purchase)
- Fields Used for Prediction: device, event, location, page
- Experiment Settings:
- Test Split Ratio: 0.3 (30% of the data is reserved for testing, and 70% is used for training).
- Auto-selected hyperparameters: max_features, criterion, n_estimators, max_depth, min_samples_split, max_leaf_nodes.
- Model Performance: The model is designed to identify patterns in user interaction data, enabling real-time predictions
about the likelihood of purchase completion. By analyzing historical data, the model helps the Predictrix platform:
- Enhance user experience by targeting users likely to abandon purchases.
- Trigger alerts for potential abandoned carts.
- Provide actionable insights to improve conversion rates.
4. Real-Time Alerts
Set up this alert in Splunk to track interactions on the "Checkout" page
Condition: The alert will trigger whenever there is at least one event where a user interacts with the "Checkout" page.
Search Query: The query looks for events in the predictrix index where the page is identified as "Checkout."
It then extracts details like the device used, the type of event, the user's location, the page, the timestamp, and the user ID.
Action: When the alert is triggered, it adds the alert to the "Triggered Alerts" list and sends a notification via a webhook.
index=predictrix | search page="Checkout"
                 | table device, event, location, page, timestamp, user_id
This alert helps monitor user interactions on the checkout page, and the data can be used for tracking behavior, troubleshooting, or analytics purposes.
 LinkedIn
 Resume
 Gmail
Gmail